
Stocks around the world have recently traded in and out of a bear market — usually defined as a 20% decline from their recent peak. Peter Oppenheimer, chief global equity strategist in Goldman Sachs Research, writes that the history of bear markets can offer clues about the duration and severity of these downturns.
US stocks rallied recently after President Trump announced a 90-day pause on the additional country-specific portion of the “reciprocal” tariff. But Oppenheimer suggests that the conditions for a sustained rebound aren’t yet in place. “Valuations need to adjust further before equities can transition into the ‘hope’ phase of the next cycle — the powerful rebound that typifies the transition into a new bull market,” Oppenheimer writes.
What can we learn from previous bear markets?
The team finds that there are three distinct categories of bear market. Firstly, structural bear markets, like the Global Financial Crisis in 2007-2008, are triggered by structural imbalances and financial bubbles. Often, these events are associated with a price shock such as deflation and are followed by a banking crisis.
Secondly, cyclical bear markets are a function of the economic cycle, which rises and falls. They’re triggered by, for example, rising interest rates, impending recessions, and declining profits.
The last category is event-driven bear markets, which are triggered by a one-off shock that either doesn’t lead to a recession or temporarily knocks an economic cycle off course. Common triggers are wars, an oil price shock, a crisis in emerging markets, or technical market dislocations. An example of an event-driven bear market is the downturn during the Covid pandemic. The economy was reasonably balanced when the pandemic hit, with both economic growth and inflation at low, stable levels. The recovery for markets hit by event-driven downturns tends to be short-lived, and the recovery is usually rapid.
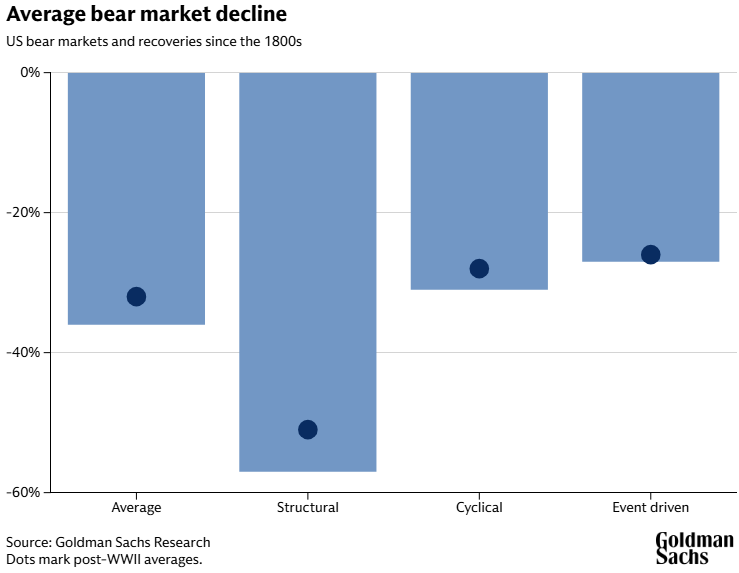
The average cyclical and event-driven bear markets generally tend to fall around 30%, although they differ in terms of duration. Cyclical bear markets last an average of around two years and take about five years to fully rebound to their starting point, while the event-driven ones tend to last around eight months and recover in about a year.
Structural bear markets have by far the most severe effects. The average declines are around 60%, playing out over three years or more, and they tend to take a decade to fully recover, Oppenheimer writes.
“Of course, identifying the type of bear market is easiest in retrospect but more complicated in real time,” Oppenheimer writes in the report. A bear market may begin as one type and then transform into another.
How severe was the recent market downturn?
Oppenheimer’s team points out that the latest market decline was event driven, triggered by the sharp rise in tariffs announced by the US. The strong prospects for global economic activity at the start of the year reinforce this view.
“However, it could easily morph into a cyclical bear market given the growing recession risk,” Oppenheimer adds. Goldman Sachs Research’s economists have lowered their US GDP growth forecasts for 2025 and have indicated an increasing risk of recession.
Both event-driven and cyclical bear markets have an average stock market decline of around 30%, but event-driven downturns tend to be shorter and recover more quickly.
Goldman Sachs Research’s equity bull/bear indicator, which helps to identify potential downturns in stock markets, remains high as of April 8, signalling an increased risk of the market falling. With valuations for US stocks still high, and unemployment very low (and therefore at risk of rising), there is further room for US stocks to fall, Oppenheimer writes.
What will it take for stocks to recover fully?
Looking at bear markets since the 1980s, the team sees a pattern of rebounds before the market typically reaches a trough.
Looking at 19 global bear market rallies since the early 1980s, the team finds that they have lasted an average of 44 days and the average return of the MSCI AC World Index has been 10-15%.
“Given the very sharp falls in investor sentiment over the past few days, it would be typical for there to be a bounce in equity prices,” Oppenheimer writes.
Most bear markets recover fully within a year. Oppenheimer’s team is looking for four signals before it expects to see a sustained rebound in stock prices:
- Attractive stock valuations
- Extreme positioning (investor portfolios signal so much pessimism that a repositioning of their holdings becomes more likely)
- Policy support
- A sense that the second derivative (the rate of change of the rate of change) of growth is improving
In practice, stock valuations are still relatively high by historical standards — especially in the US, where stock market capitalization was at a record-high valuation relative to GDP before the downturn.
Interest rate cuts, which also play a big role in helping bear markets to recover, do not seem to be imminent at this stage. However, our economists think that could change if a recession becomes more likely.
Economic growth momentum seems unlikely to accelerate significantly in the near term, with higher-frequency survey data remaining weak. Additionally, market sentiment and investor positioning of portfolios are shifting towards more negative levels, with Goldman Sachs’ risk appetite indicator registering one of the largest two-day drops since 1991 following the latest tariff announcements.
As mentioned earlier, an event-driven bear market can morph into a cyclical one if it triggers a recessionary outcome in which company profits fall. But the current downturn doesn’t have the characteristics of a severe structural bear market.
“Broadly speaking, the corporate sector has healthy balance sheets and banks are well capitalised. Equally, while equity valuations are high, particularly in the US, they have not been in bubble territory, in our view,” Oppenheimer writes.
“This makes us more confident that this bear market will be more modest in depth and duration than previous structural downturns,” he adds.
What’s the outlook for non-US stocks?
US stocks have consistently outperformed their peers for nearly 15 years, leading to high valuations. But the recent equity declines, which started in the US, reversed this trend.
The downturn was driven in part by falling prices among the largest US technology companies. The sharp falls in some of these tech names resulted in a bigger hit to US stocks than to other global stock markets and indexes.
“For much of the first quarter of this year, other equity markets (unusually) managed to de-couple,” Oppenheimer writes. He adds that non-US stocks were supported by expectations of higher fiscal spending by the new German government and technology breakthroughs in China.
However, non-US stocks also fell recently as the scale of the downturn in US markets became clear and recession fears began to rise.
“Whenever the US has experienced a fall of more than 10%, other equity markets also fall — even if, on occasion, they outperform on a relative basis” Oppenheimer writes.
For now, high US stock valuations amid higher inflation and lower corporate profitability may be a reason for investors to consider international diversification.